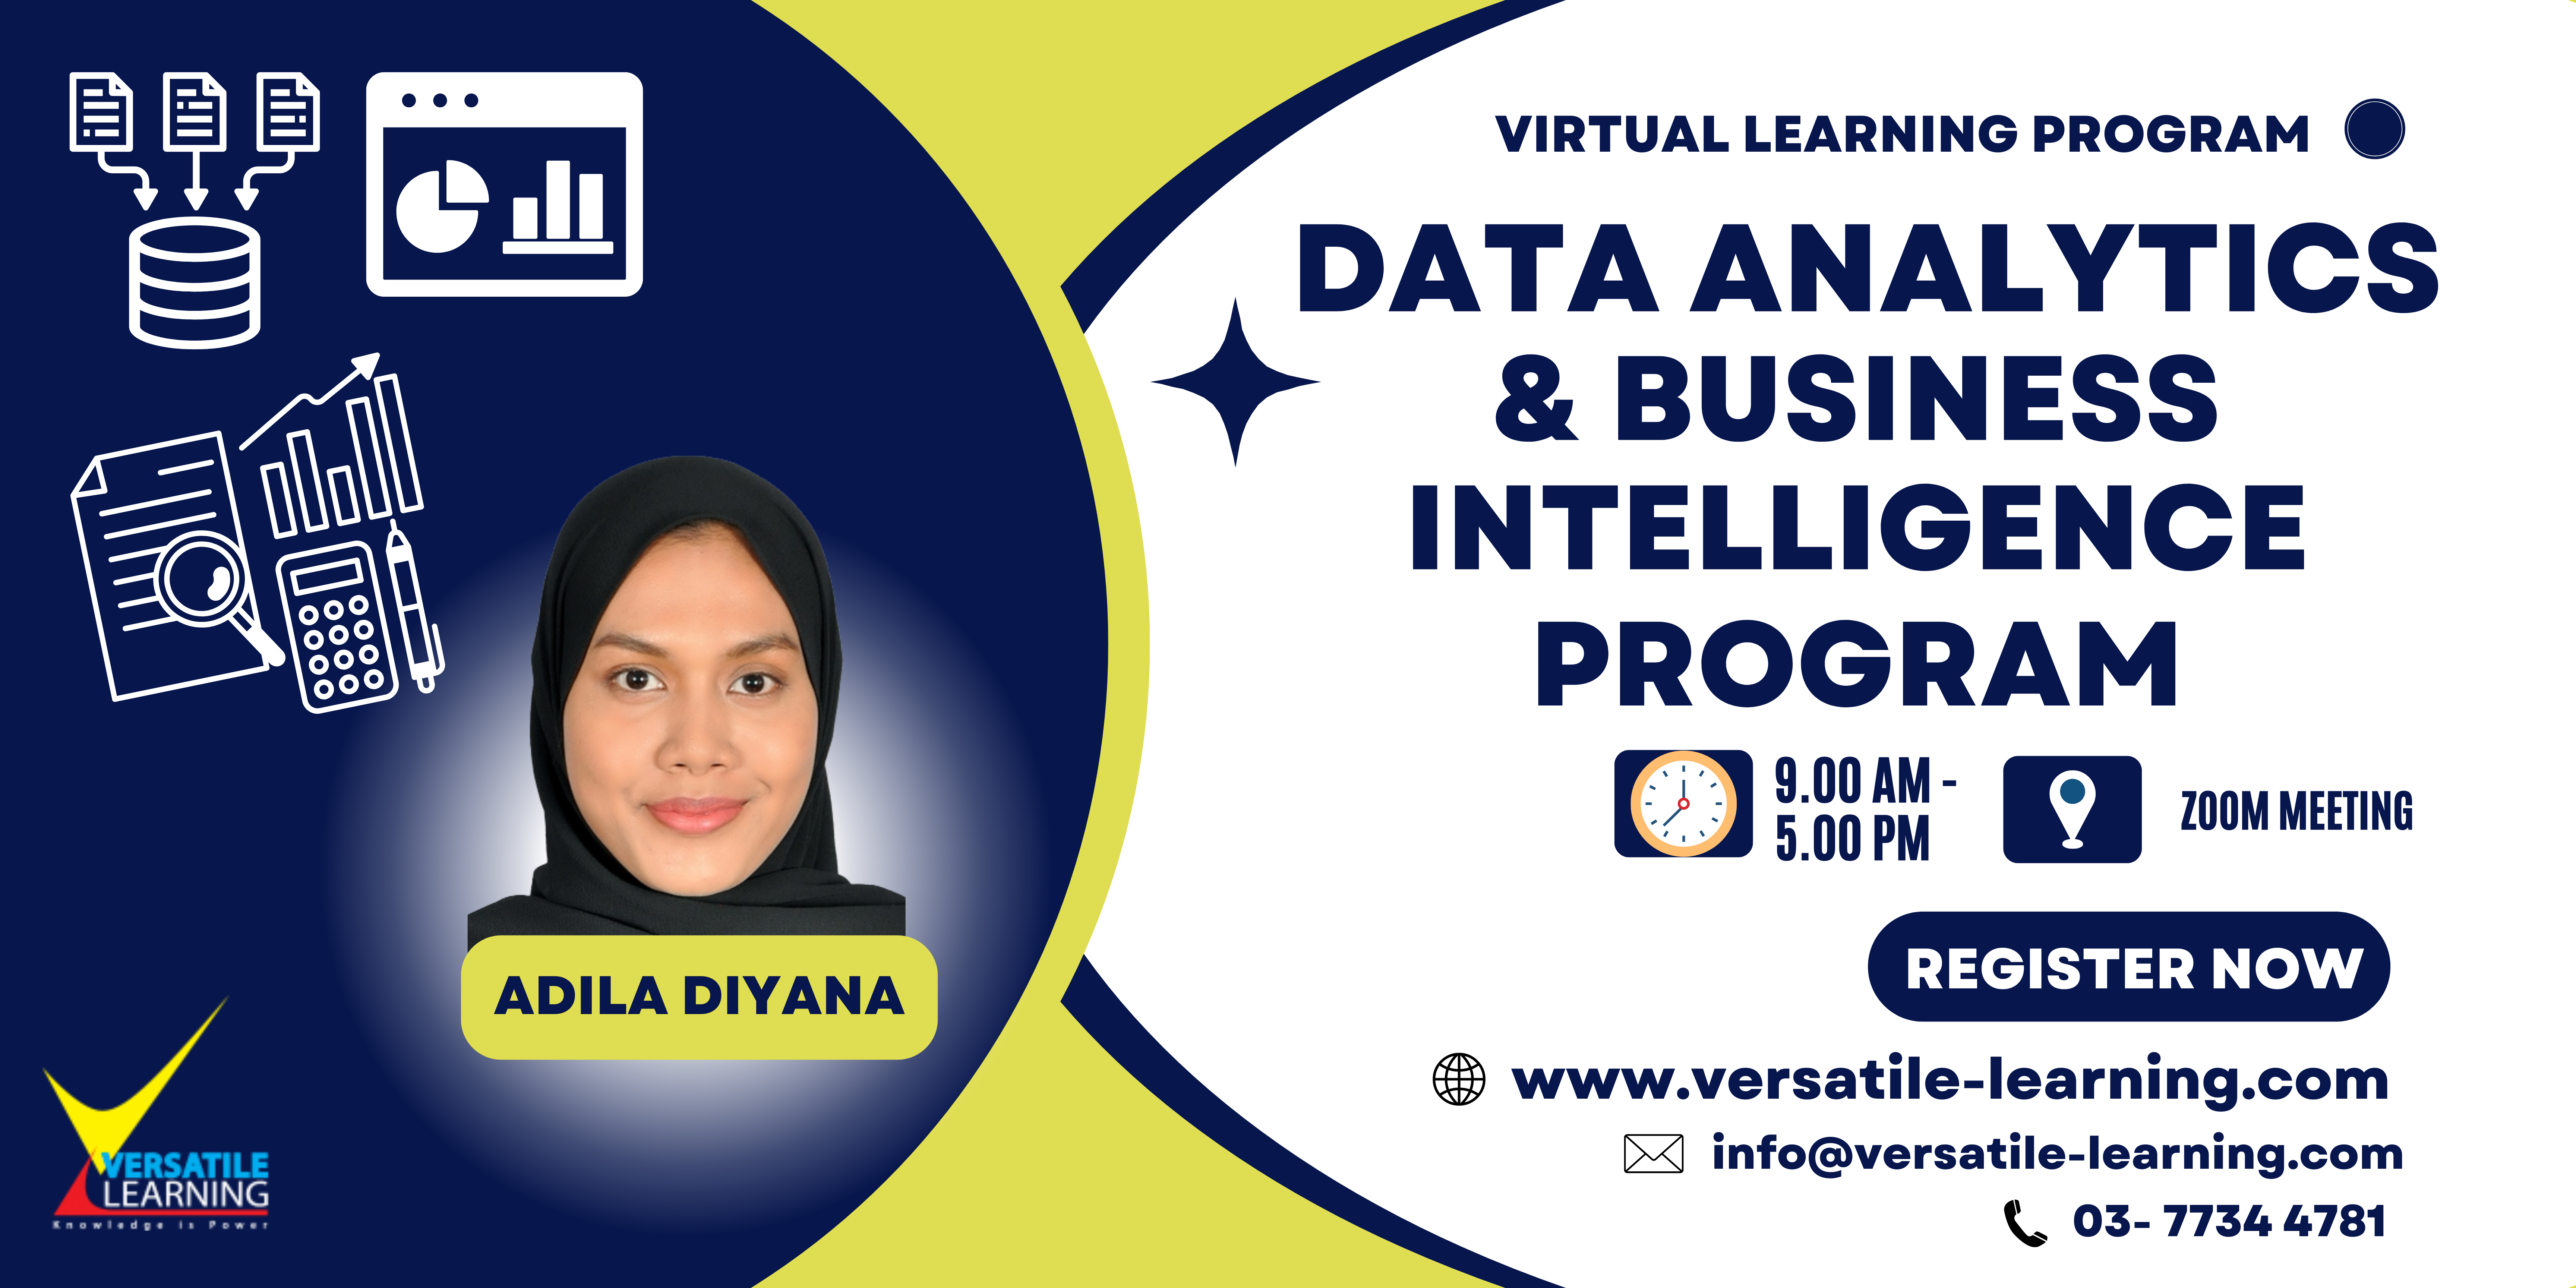
In today’s data-driven world, organizations need professionals who can turn raw data into actionable insights. This masterclass provides a comprehensive foundation in data analytics and business intelligence (BI)—from data exploration to dashboard creation—using tools like Excel, Power BI, and real-world case studies.
MOF 003 – Data Analytics & Business Intelligence Masterclass, 11 & 12 August 2025
MOF 003 – Data Analytics & Business Intelligence Masterclass, 11 & 12 August 2025
Teachers
Adila Diyana
RM 1,500.00
RM 1,500.00
| Duration: 2 Days |
| Lectures: Zoom Meeting |
| Certificate of Completion |
INTRODUCTION
OBJECTIVES
By the end of this program, participants will:
- Understand the role of data analytics and BI in business strategy
- Learn to clean, analyze, and visualize data effectively
- Gain hands-on experience with BI tools (e.g., Excel, Power BI)
- Interpret data to support decision-making and performance tracking
- Build interactive dashboards and reports
WHO SHOULD ATTEND?
- Business analysts, executives, and decision-makers
- Data enthusiasts and Excel users transitioning into BI
- HR, finance, marketing, and operations professionals
- Entrepreneurs and startup teams
- Anyone looking to make smarter, data-driven decisions
FEEDBACK
- Ms. Adila delivers the training properly and is good at teaching.
- The trainer’s delivery method is very good & easy to understand.
1 DAY TRAINING MODULE
Full Training content is restricted to members only. Please log in to view more details. Registration are Free!
Day One (9am - 5pm)
- What is data analytics vs. business intelligence?
- The data-to-decision lifecycle
- Types of analytics: descriptive, diagnostic, predictive, prescriptive
- Case Study: How companies use BI to drive performance
- Data types, sources & importing datasets
- Cleaning messy data using Excel functions
- Removing duplicates, handling missing values
- Hands-On Exercise: Data cleaning challenge
- Sorting, filtering, and summarizing data
- Pivot tables, charts, and conditional formatting
- Identifying trends and outliers
- Activity: Mini data exploration project
Day Two (9am - 5pm)
- Data tables, relationships, and normalization
- Introduction to DAX (Data Analysis Expressions)
- Calculated columns and measures
- Hands-On: Creating a data model
- Designing dashboards for decision-makers
- Using slicers, filters, and drill-downs
- Visualizing KPIs and performance metrics
- Activity: Build a dynamic dashboard
- Turning insights into compelling stories
- Choosing the right visuals for your message
- Presenting data to non-technical stakeholders
- Practice: Present your dashboard to the group
About Instructors

Adila Diyana
- Kursus Word & Excel ( Intermediate & Advanced) Siri 2
- Kursus Microsoft Excel
- Finance for Beginner
- EIS Microsoft Office Inclusive Excel, Word, PowerPoint and Outlook
RM 1,500.00
| Duration: 2 Days |
| Lectures: Zoom Meeting |
| Certificate of Completion |

